Related Downloads
Additional
Appendix 1 – Breakdown of calls to Police Scotland
This year saw a significant change to incoming calls to the service centres.
Table 1 – Call handling statistics
Total calls |
Totals 999 calls |
Total 101 calls |
Average answer time YTD – 999 calls |
Average answer time YTD – 101 calls |
Contact us forms |
Online reports |
|---|---|---|---|---|---|---|
2,191,059 |
814,980 |
1,376,079 |
9 seconds |
5 minutes 33 seconds |
193,155 |
116,379 |
Table 2 – 999 and 101 calls records
YTD |
PYTD |
% change |
|
|---|---|---|---|
Total number of calls |
2,191,059 |
2,184,926 |
0.3% |
Total number of 999 calls |
814,980 |
741,801 |
9.9% |
Total number of 101 calls |
1,376,079 |
1,443,125 |
-4.6% |
This shows changes from the previous year with a slight increase of incoming calls (0.3%) but this is based on a significant increase of 999 calls (9.9%). These calls are often more complex and require more police input to resolve the matter. Thus, for a relatively small increase in overall call volume, there is likely to have been a significant increase in demand for frontline services.
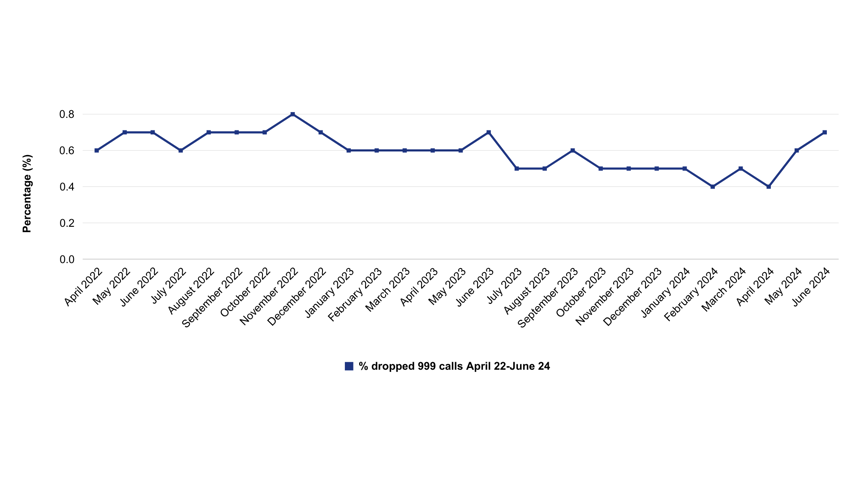
Police Scotland has continued to answer 999 calls within the 10 second target and has not seen significant change to the low number of dropped 999 calls (table 3 below), but there has been slippage on the average time to answer a non-emergency call. The increase in emergency calls suggests a reduction in capacity to deal with non-emergency (101) calls: the volume of 101 calls answered has decreased by almost five per cent, and the time it takes to answer 101 calls has increased by almost a quarter in the past year. This impact on non emergency calls may have a corresponding effect on public confidence and preventative work. When first considered, the 101 service was designed as a public service call where the caller could be directed to whichever service best met their needs – whether that was a local authority, health, police or other service. On implementation, the only service that adopted 101 was policing, leading to the other services being less involved in genuine public demand.
Table 3 – Average answer time for 999 and 101 calls
Average answer time YTD |
Average answer time PYTD |
% change |
|
|---|---|---|---|
999 calls |
9 seconds |
9 seconds |
0.0% |
101 calls |
5 minutes 33 seconds |
4 minutes 27 seconds |
24.7% |
Figure 3 – Dropped 999 calls from April 2022 to June 2024

